Overview
Honeypots are one of the most honest ways to understand the real threat landscape. Instead of reading reports about what attackers are doing, you just... let them in — into a controlled, fake environment — and watch. I've been curious about this for a while, and I finally decided to set one up properly using T-Pot CE, an all-in-one honeypot platform by Telekom Security that bundles over 20 different honeypot types under a single Docker-based stack.
For this experiment I used Vultr — if you want to try this yourself, you can sign up for a free $300 credit using that link. The whole 20-day run cost me roughly $10, which is honestly incredible for the data you get back.
Multi-Protocol Coverage
T-Pot captures attacks across SSH, RDP, VNC, SIP, ADB, Telnet, HTTP/S, and many more simultaneously.
Kibana Dashboards
Built-in Elasticsearch + Kibana stack gives you beautiful real-time dashboards over all captured attack data.
Live Attack Map
A live world map showing attacks hitting your server in real time, with attacker geolocation and origin country.
Raw Log Export
All raw logs are stored in ~/tpotce/data, exportable for offline analysis in any tooling you like.
Safe & Isolated
Attackers interact only with the honeypot containers. Your actual server and SSH access are moved to a non-standard port.
Docker-Based Stack
Everything runs in Docker containers. Easy to install, easy to remove, and isolated from the host OS by design.
How T-Pot Works
T-Pot works by listening on virtually every port and simulating a wide variety of services. When an attacker connects and tries to exploit or authenticate, the honeypot logs every detail — credentials used, payloads sent, timing, origin IP — and feeds it all into Elasticsearch for analysis. Your real SSH access gets moved to a random high port during installation so you can still manage the machine safely.
Setting Up Vultr
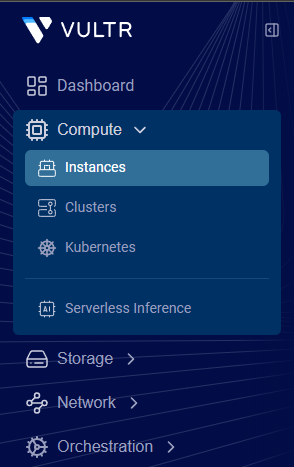
After logging in to Vultr, navigate to Compute → Instances and click Create Instance. The setup is straightforward — here's what I picked and why.
-
Choose Shared CPU
Select Shared CPU as the server type. For a honeypot experiment this is more than enough — we don't need dedicated compute.
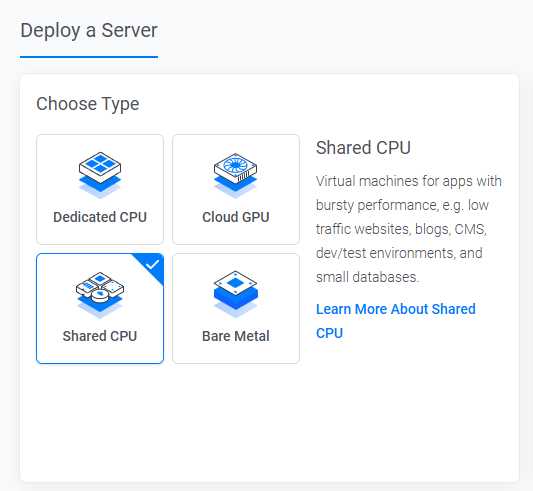
Selecting Shared CPU — the right choice for a cost-effective honeypot. -
Pick a Region with High Exposure
I chose Americas / Silicon Valley. The idea here is simple — higher traffic regions attract more attention from automated scanners and botnets, which means more attack data for us to study.
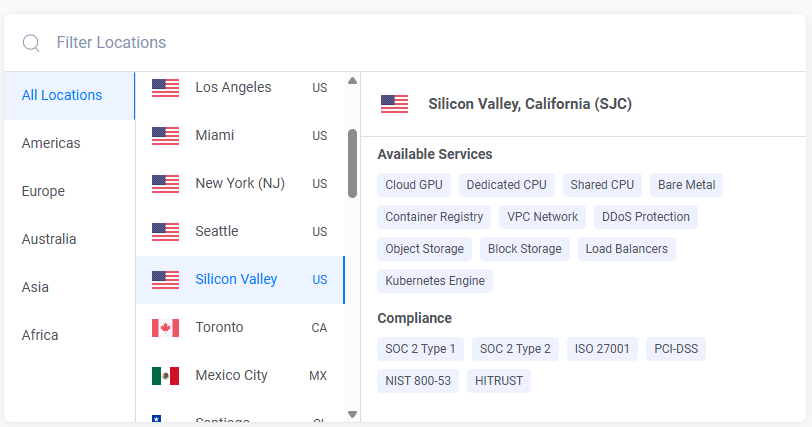
Silicon Valley region — well-connected and popular with scanners. -
Size It Right for T-Pot
T-Pot runs a lot of Docker containers and Elasticsearch is memory-hungry. I went with 4 vCPUs, 8 GB RAM, 180 GB SSD. This ran the full stack smoothly for the entire 20 days without any issues. Total cost was around $10 for the experiment.

4 vCPU / 8 GB RAM / 180 GB SSD — the recommended minimum for T-Pot CE. Cost TipRunning this for 7 days costs roughly $5–7. For 20 days it came to around $10. Vultr bills by the hour so you can stop it anytime without wasting money.
-
Select Ubuntu as the OS
T-Pot officially supports Ubuntu. Select Ubuntu 22.04 LTS — don't use any other distro or you'll run into dependency issues during the install script.
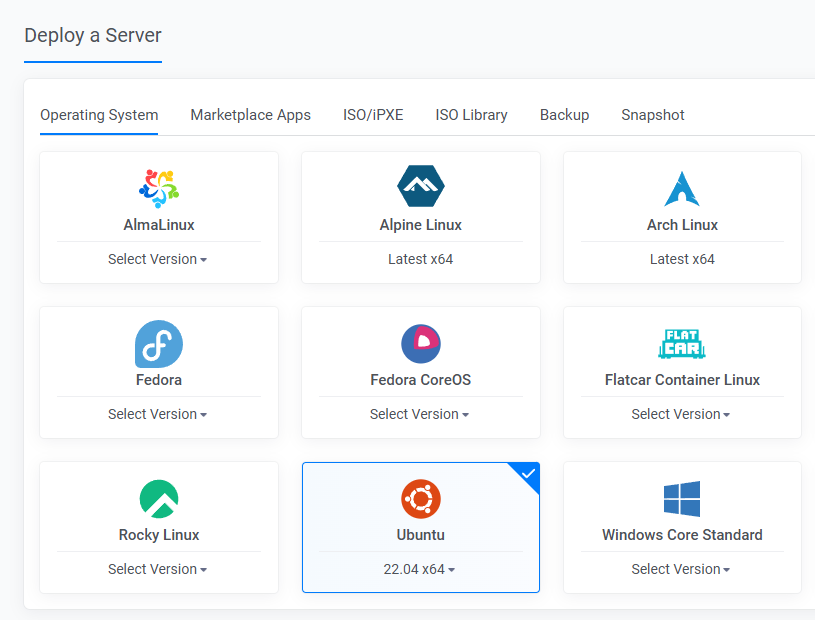
Ubuntu 22.04 LTS — the recommended OS for T-Pot CE.
After hitting deploy, the instance takes a minute or two to boot up. You can watch its status from the Vultr dashboard.
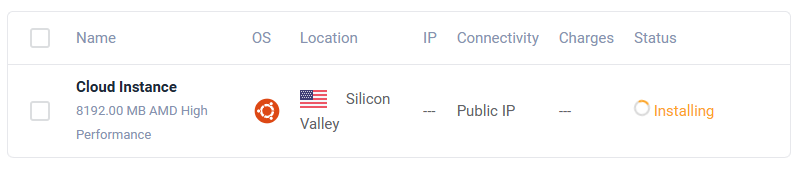
Server Configuration
Once the instance is running, head to its dashboard page — you'll find the public IP address and the root password right there. Use those to SSH in.

$ ssh root@YOUR_SERVER_IP
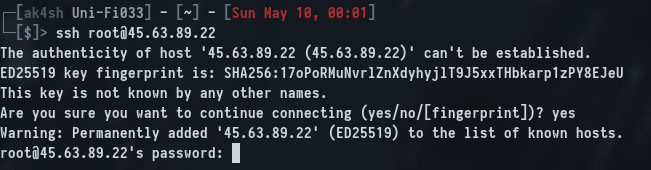
We're in as root. T-Pot's installer needs a non-root user to run correctly, so our first step is to create a dedicated user and give it sudo privileges.

whoami confirms we're root — time to create a dedicated user.-
Create a New User
Run
adduserand just keep pressing Enter through the prompts — only the password matters here.Terminal# adduser tpotuser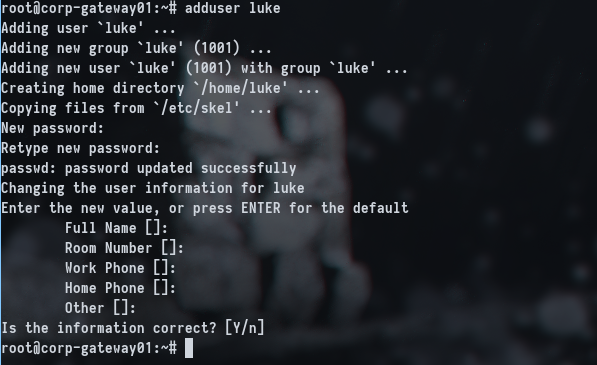
Creating the new user — just press Enter through the optional fields. -
Add the User to the Sudo Group
Terminal
# usermod -aG sudo tpotuser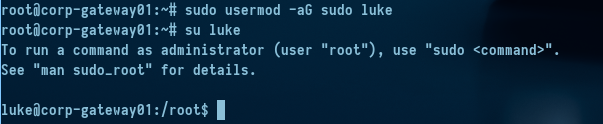
Adding our user to the sudogroup — required for the T-Pot installer.
Installing T-Pot
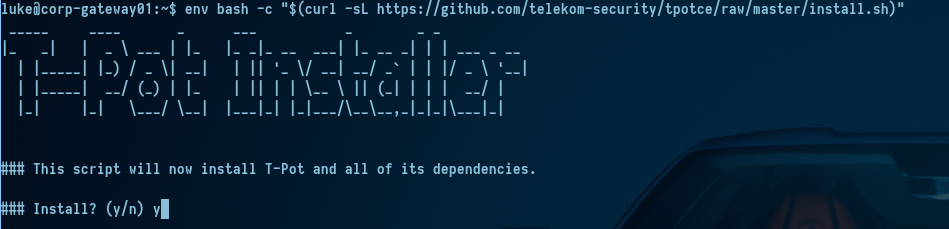
Now the fun part. T-Pot's installer is a single curl command provided on their GitHub page. It handles everything — installs Docker, pulls all the honeypot images, configures Elasticsearch and Kibana, and sets up the web UI. Run it as your new non-root user.
$ env bash -c "$(curl -sL https://github.com/telekom-security/tpotce/raw/master/install.sh)"
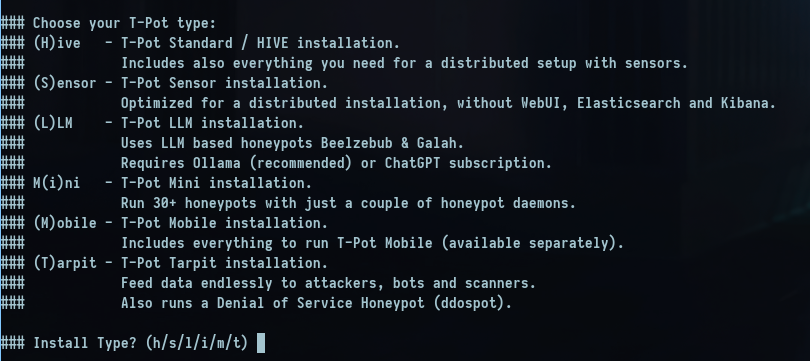
The installer presents a menu asking which edition to install. I chose H (Hive) — this installs every available honeypot type at once, giving you the widest possible coverage across protocols.
T-Pot offers several installation profiles. H (Hive) is the full edition — it runs all supported honeypots simultaneously. There are lighter profiles like S (Standard) or M (Medium) if you're working with limited RAM.
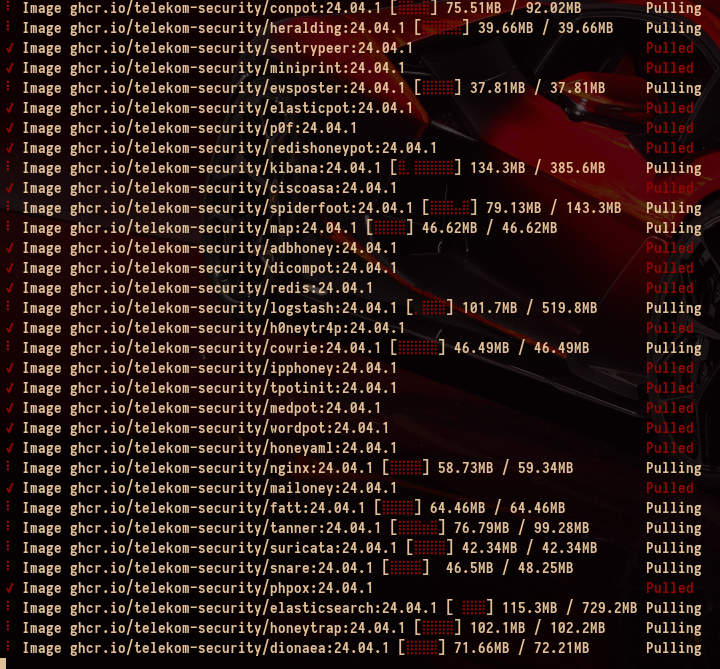
The script then downloads and configures everything. Since we're on a cloud VPS with a good uplink, this goes surprisingly fast — usually 10–15 minutes. Grab a coffee.
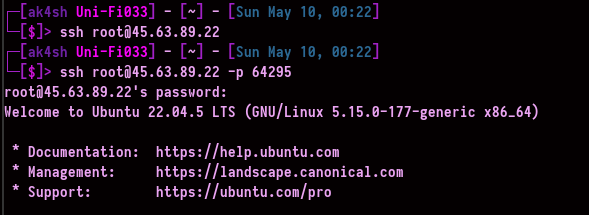
When installation finishes, the script prints your new SSH port at the end of the output. Port 22 is now a honeypot. Note down that port number before closing your terminal — losing it means losing access to your server.
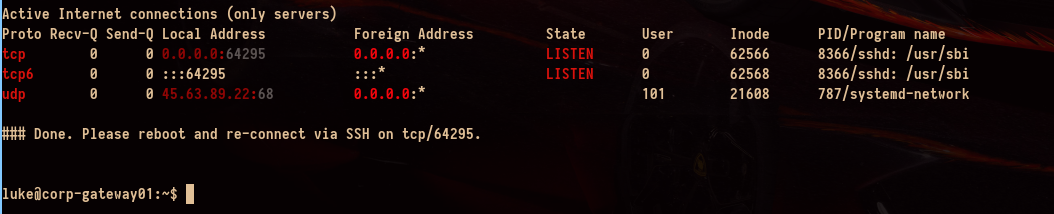
After installation the server reboots. When you reconnect, you must use the new high port (in my case it was 64265). Trying port 22 now just dumps you into the SSH honeypot, which won't accept your real credentials.
Accessing the Web UI
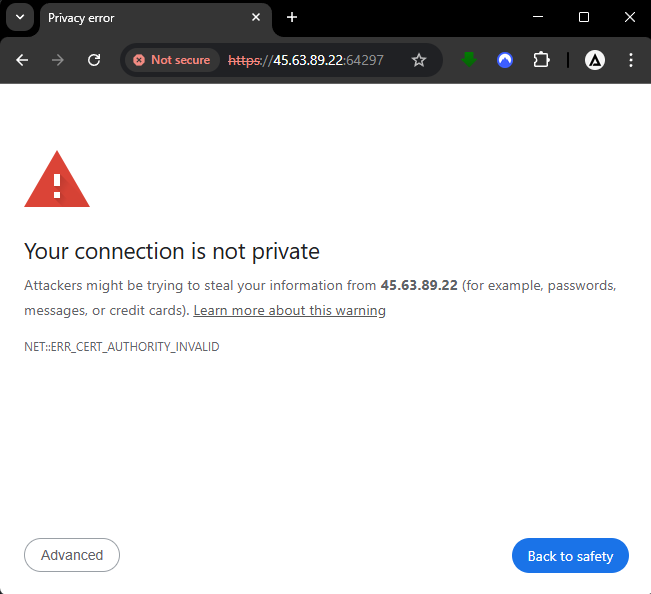
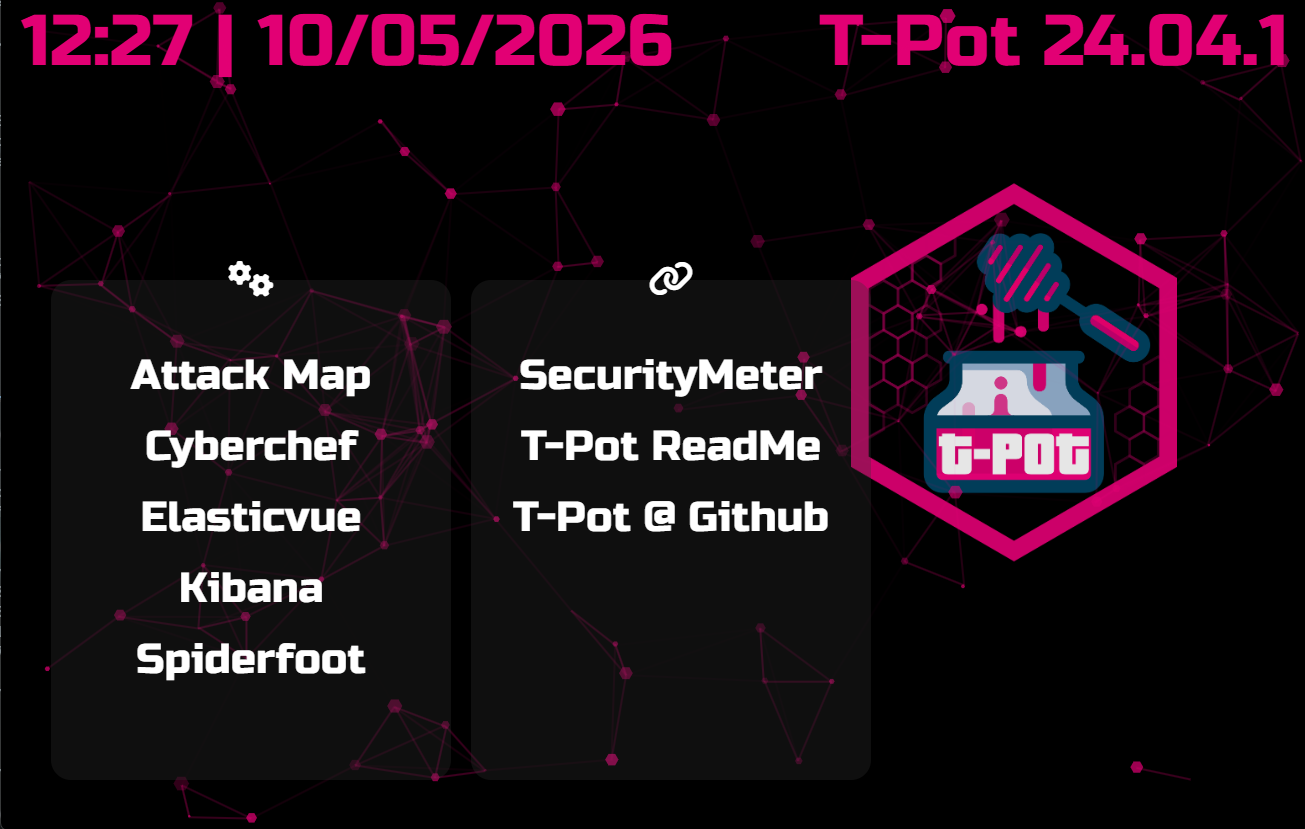
T-Pot's web interface runs on port 64297. Just open your browser and navigate to https://YOUR_SERVER_IP:64297. The username and password are whatever you set during the installation wizard.
If the page doesn't load, the most likely cause is your cloud provider's firewall (security group / firewall rules). Head to Vultr's Firewall section and make sure ports 64297 and 64265 are open for your source IP, or open them to the world if you want full access.
First Hits — Attackers Were There Immediately
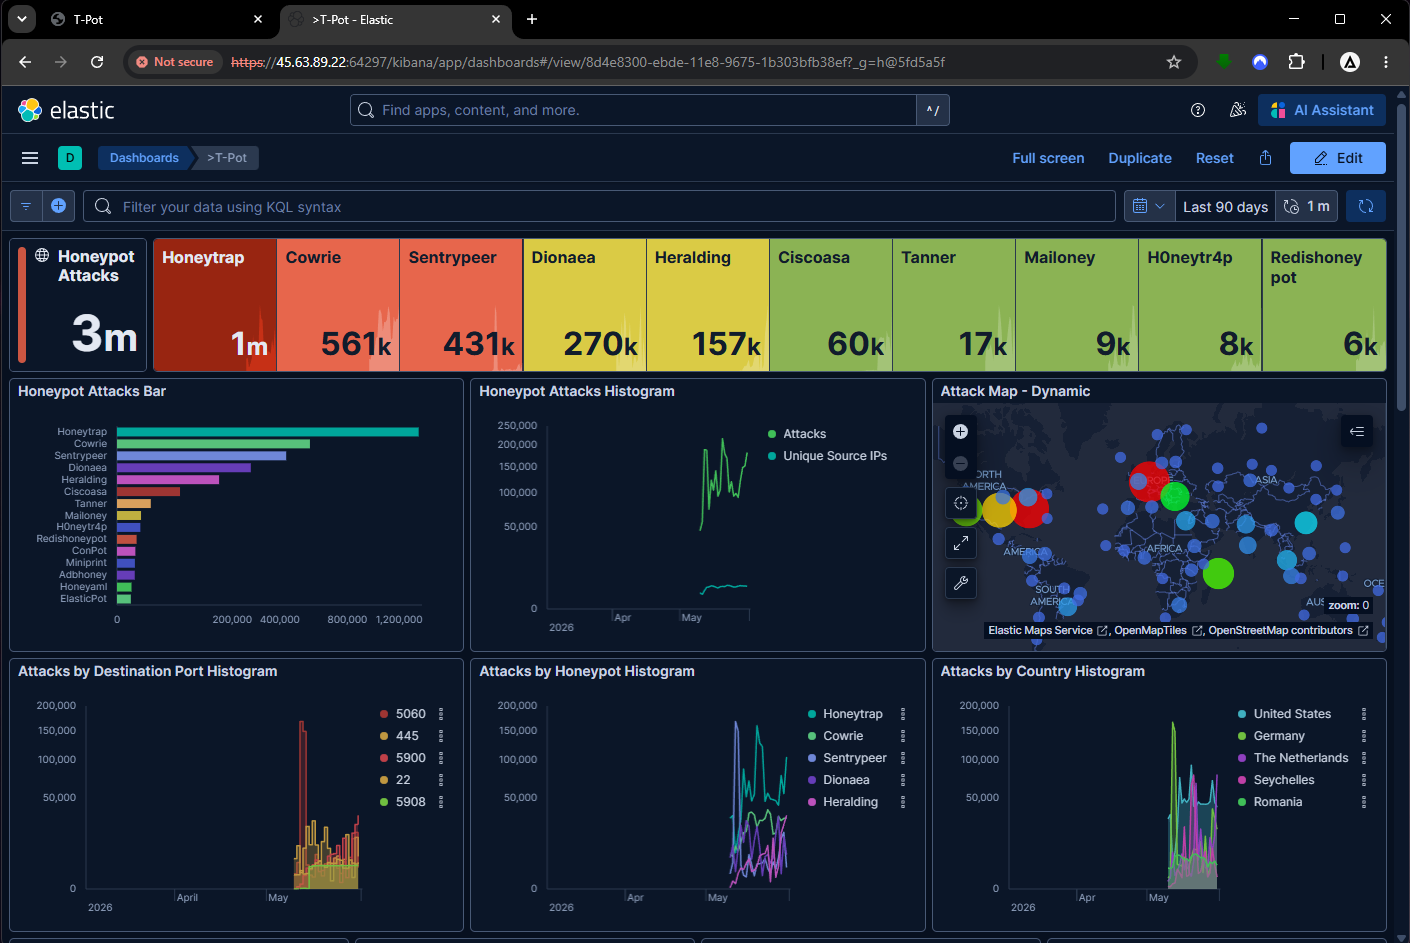
I genuinely expected to wait a few hours before seeing anything. I was wrong. Within minutes of the installation completing, the live attack map was already lighting up with incoming connections from across the globe. This is what automated internet scanners look like in practice — they are relentless and fast.
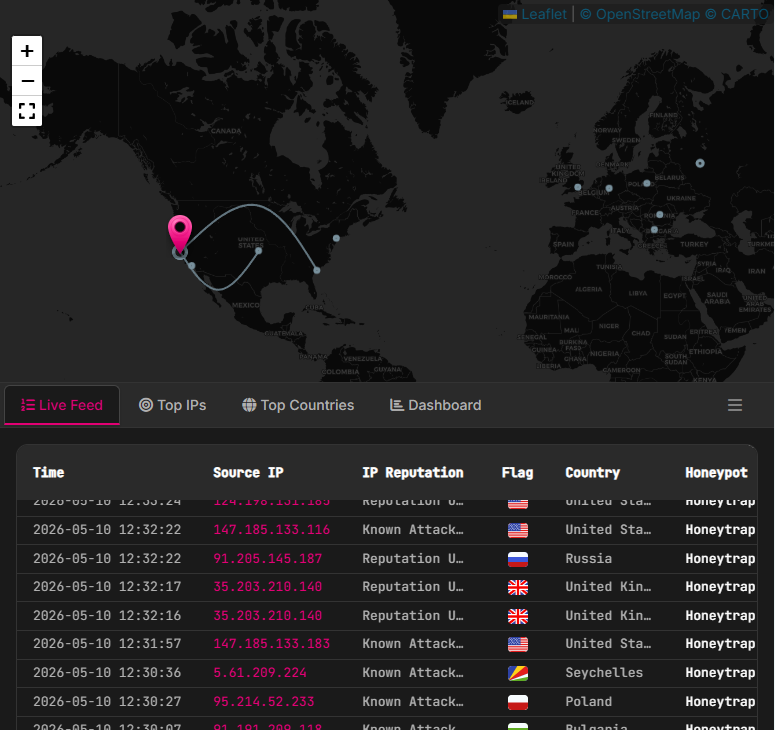
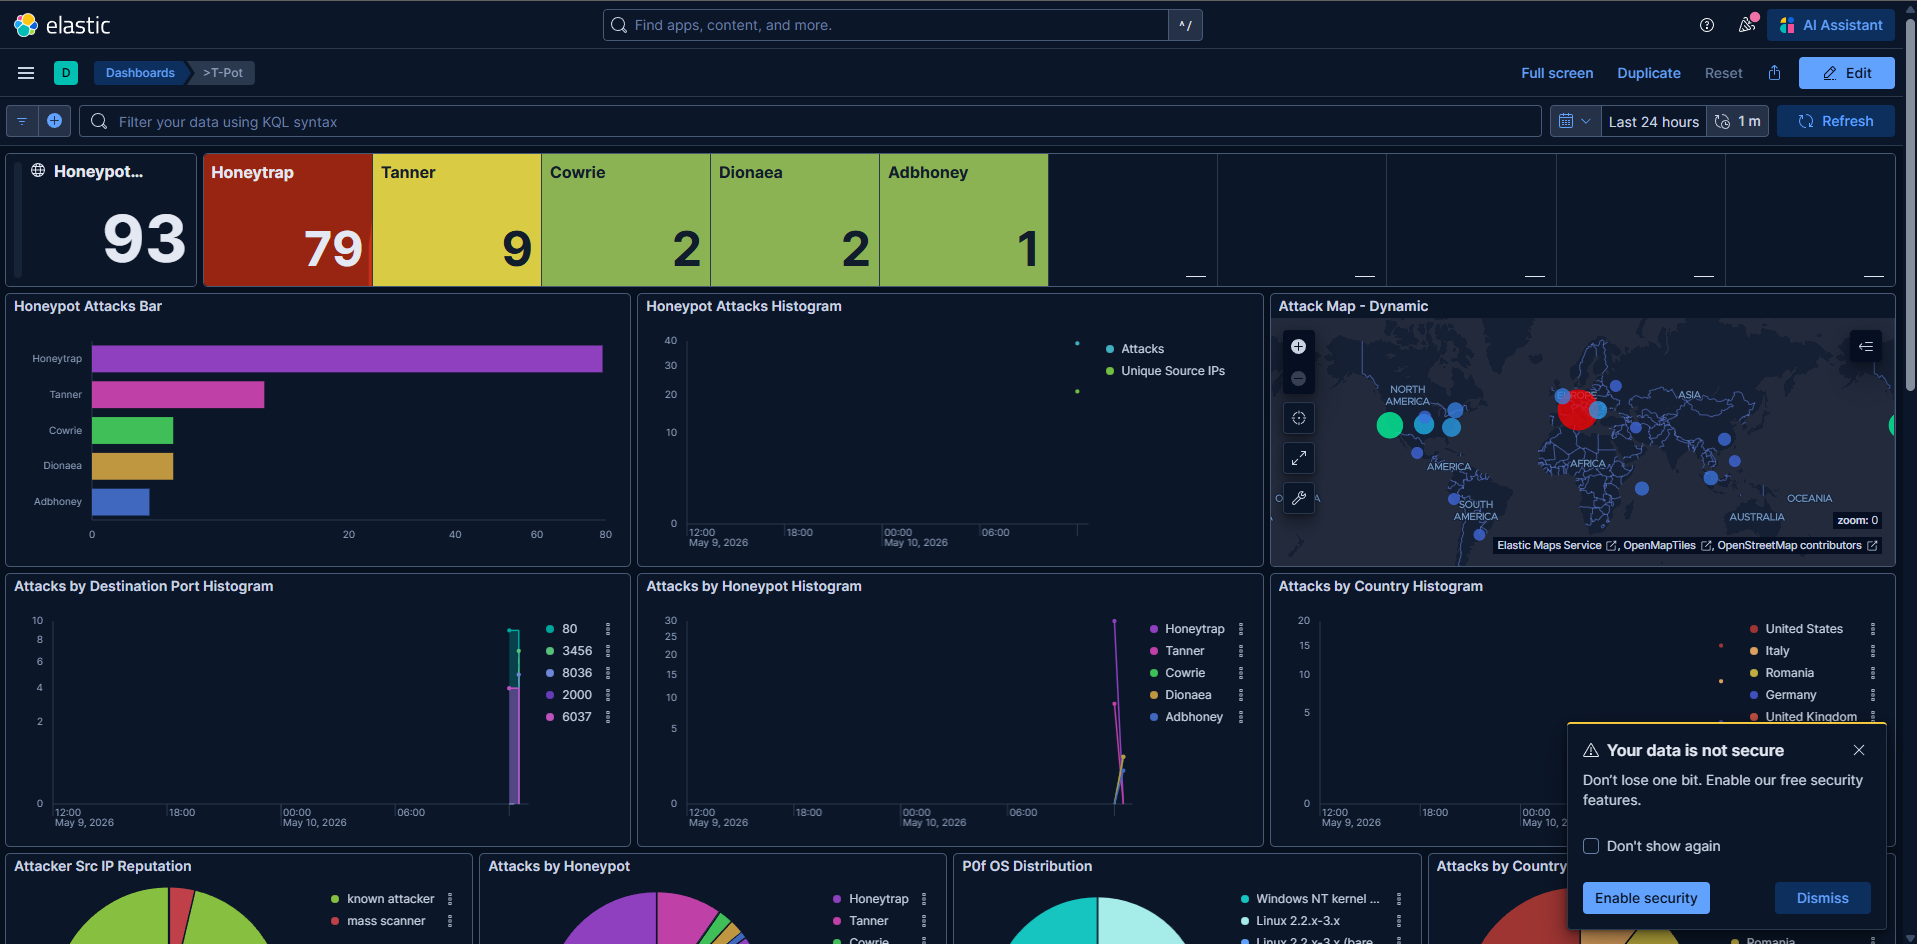
Within the first 10 minutes, the attack count had already climbed past 500,000 events. I had to double-check the numbers — but this is the reality of putting any public IP online.
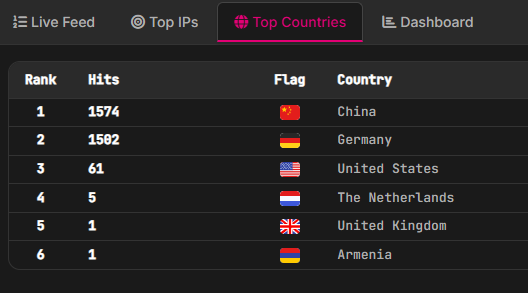
In the very first few minutes, the top attacking countries were already clearly visible:
"Every IP address that's publicly routable on the internet will be port-scanned within minutes. There are no exceptions. The question is not if — it's when and how often."
Results at 15 Days — 2 Million Attacks
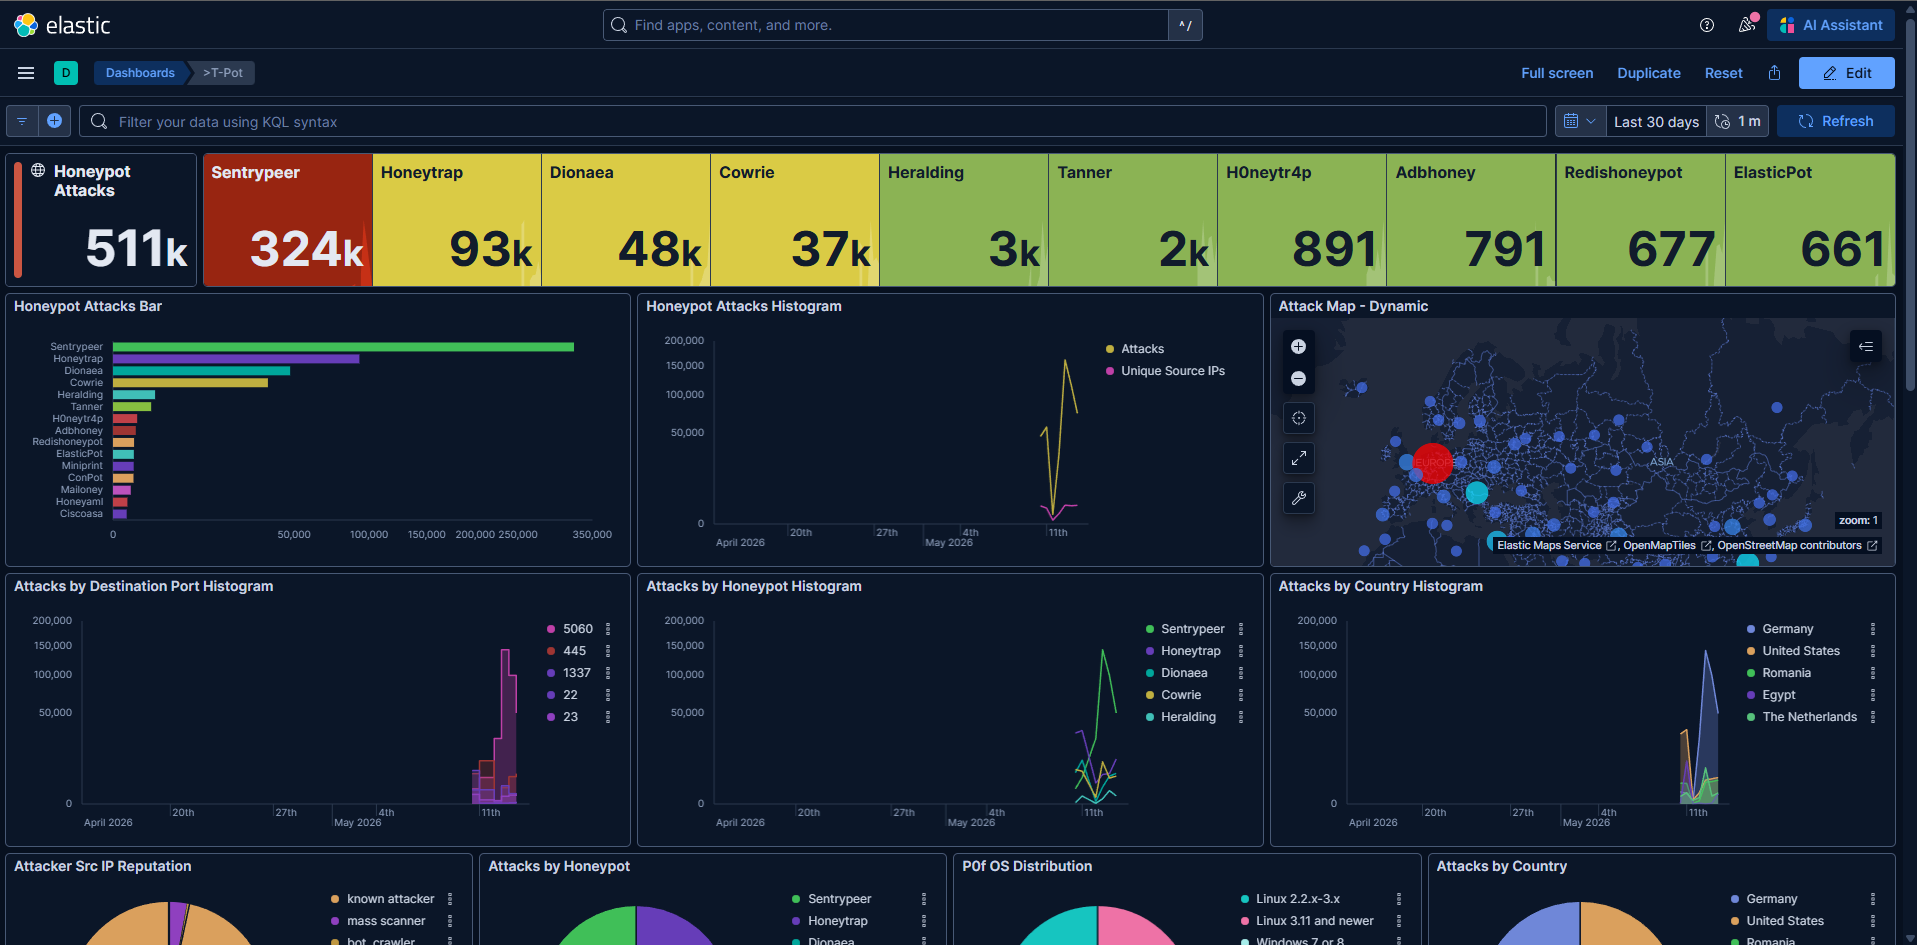
By day 15 the attack count had crossed the 2 million mark. Attackers don't sleep, don't take weekends off, and they scan 24/7.
Results at 20 Days — 3 Million Attacks
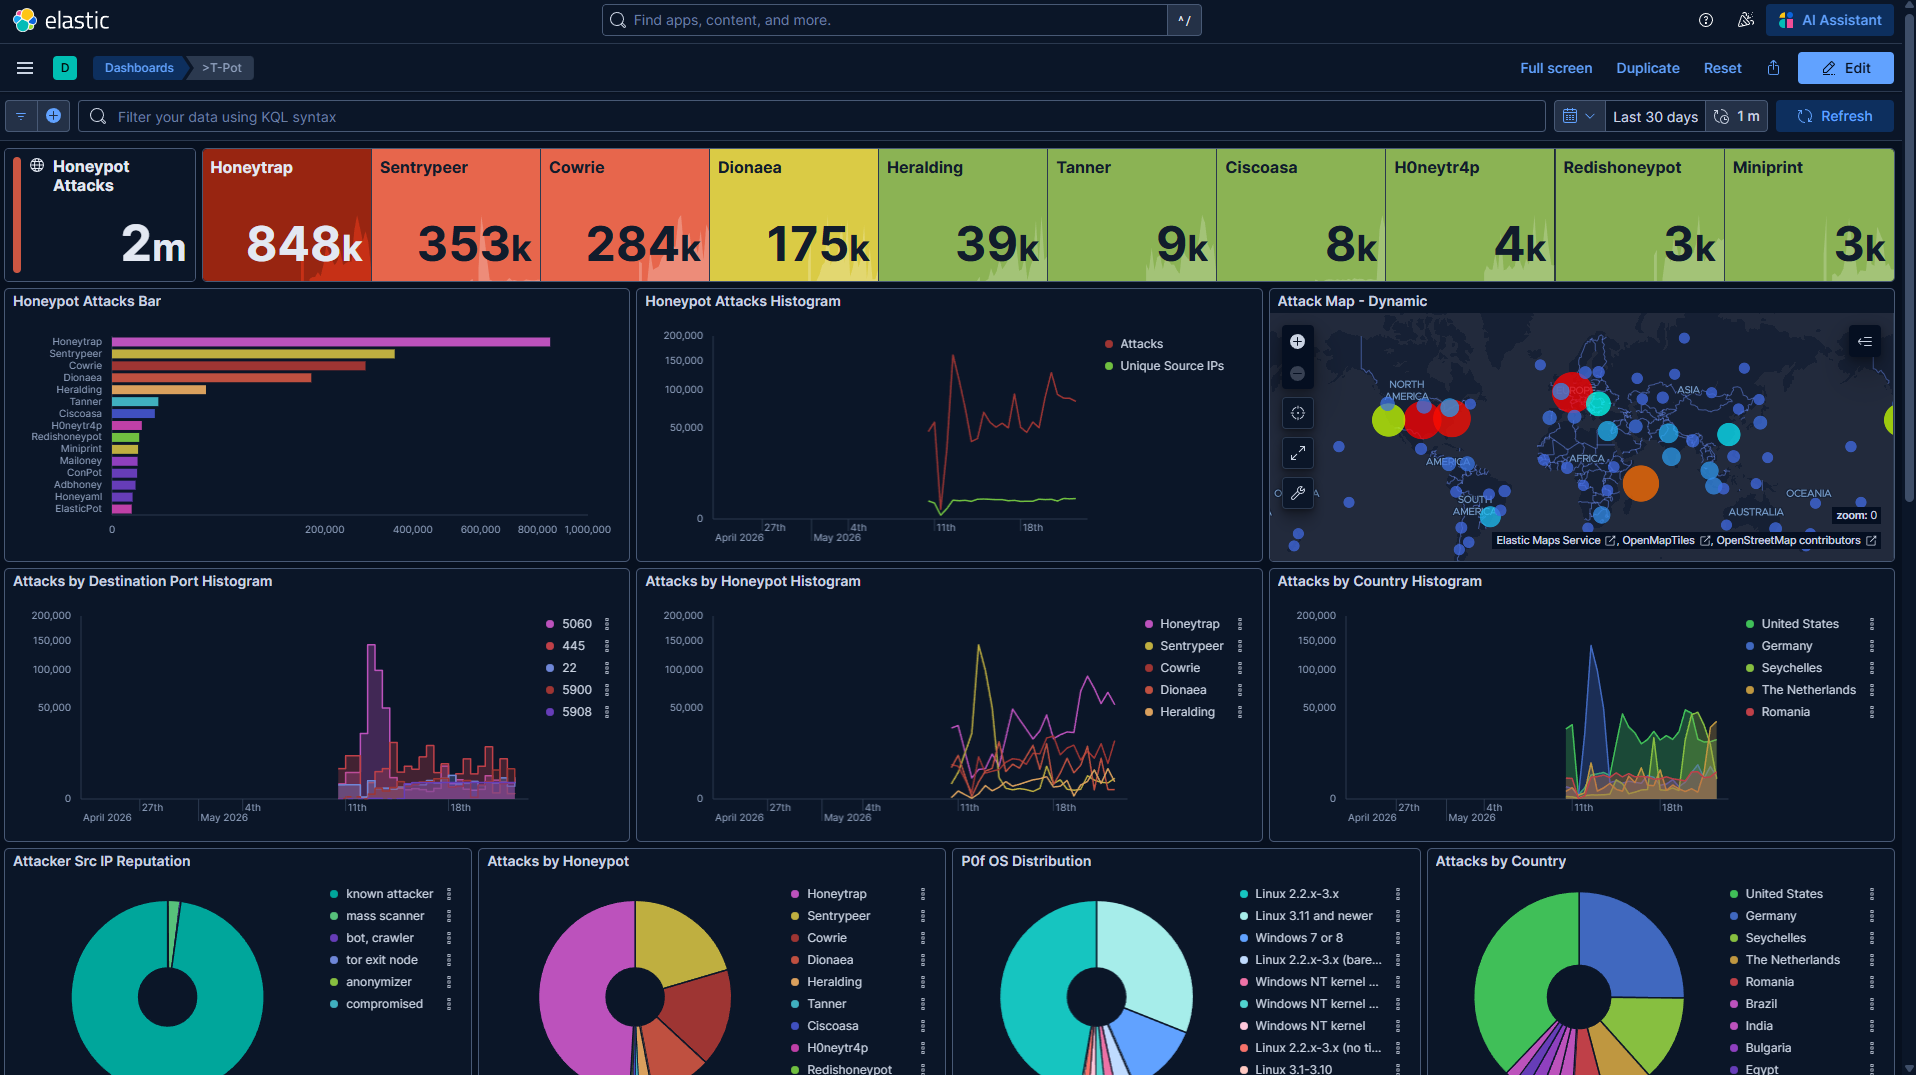
By day 20 the counter had passed 3 million total attack events. To put that in perspective — that's roughly 150,000 attacks per day, or just over 100 every minute, around the clock.
Key Findings
Beyond the headline numbers, the most interesting data came from drilling into what the attackers were actually targeting. Here's a breakdown of the key observations.
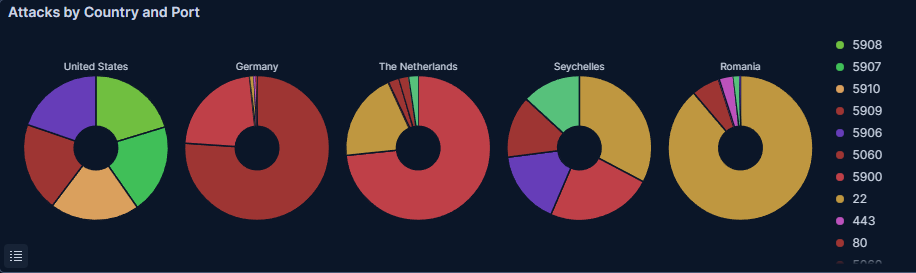
Most Targeted Ports & Countries
The attacks weren't random — specific ports were hammered far more than others, reflecting the automated tools and botnets in use.
| Protocol / Port | Description | Volume |
|---|---|---|
22/tcp SSH |
Credential stuffing & brute force against Cowrie SSH honeypot | Highest |
23/tcp Telnet |
IoT botnet recruitment attempts (Mirai variants) | Very High |
3389/tcp RDP |
Remote Desktop credential attacks targeting Windows | High |
5060/tcp SIP |
VoIP exploitation attempts via Mailoney honeypot | Medium |
5900/tcp VNC |
VNC brute force attempts against desktop access | Moderate |
5555/tcp ADB |
Android Debug Bridge — Android device compromise attempts | Moderate |
Top Attacking Countries
The United States came in as the number one source — this likely reflects the large number of compromised American infrastructure nodes and cloud-hosted attack platforms rather than direct attribution.
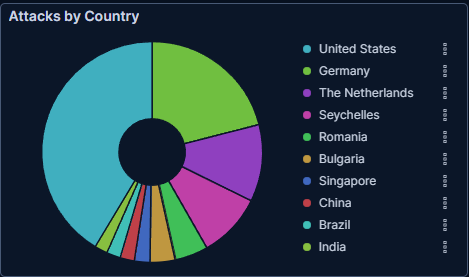
A high attack count from a country doesn't mean its government or citizens are behind it. Most attacks originate from compromised servers, cloud VMs, and botnet nodes that happen to be hosted in that country. The US leads largely because it hosts so much cloud infrastructure.
Most Targeted Usernames
The credential brute-force attempts showed clear patterns in what attackers assume default usernames to be. Unsurprisingly, they target the classics first.
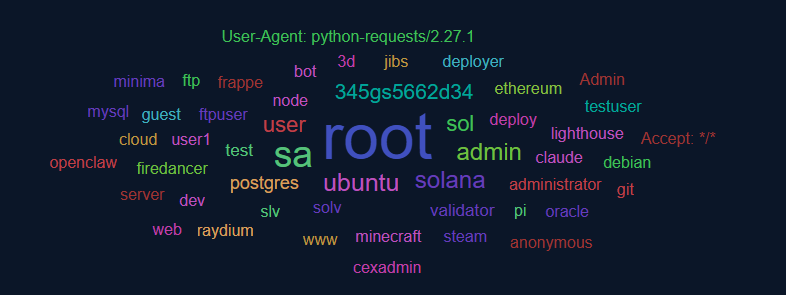
root, admin, and ubuntu are always at the top.Most Tried Passwords
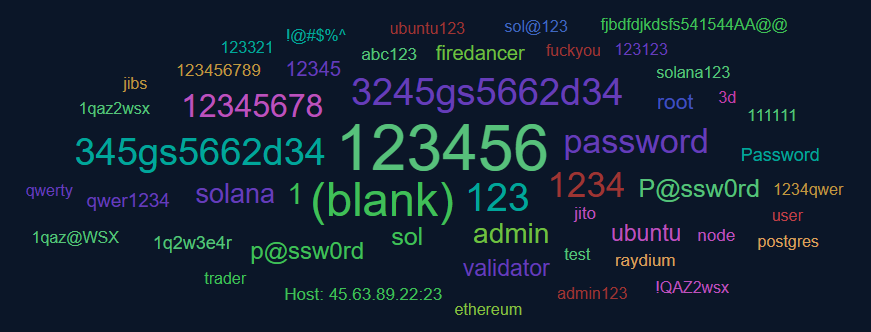
The password lists used are fascinating. They're a mix of well-known defaults, common weak passwords, and strings that are clearly from published credential dumps.
Key Takeaways
- Every public IP is scanned within minutes — there is zero grace period after deployment
- SSH (port 22) and Telnet (port 23) are by far the most targeted services
- Usernames like
root,admin,ubuntu, andpiare tried millions of times - Password lists are sophisticated — they include known defaults AND leaked credential dumps
- RDP, VNC, SIP, and ADB are all being actively probed — not just SSH
- Attack volume grows steadily as your IP gets added to scanner databases
- The US hosts more attacking infrastructure than any other single country
- Full log analysis of raw PCAP and JSON data — coming in a follow-up post
- Protocol-specific deep dive (VNC, SIP, ADB payloads) — coming soon
What's Next
After 20 days I shut down the server and transferred all the raw logs out of ~/tpotce/data. The data folder contains structured JSON logs for every protocol — SSH, Telnet, RDP, VNC, SIP, ADB, HTTP, and more. There's a lot to dig through.
All T-Pot logs are stored in ~/tpotce/data in JSON format, organized by honeypot type and date. You can rsync or scp the entire folder out before destroying your instance. These logs are gold for offline analysis.
$ rsync -avz -e "ssh -p 64265" tpotuser@YOUR_SERVER_IP:~/tpotce/data/ ./tpot-logs/
In the next post I'll go through the raw logs in detail — looking at specific payloads, commands attackers attempted to run inside the Cowrie SSH honeypot, and what the ADB and SIP traffic actually contained. There are some genuinely interesting findings buried in there.
If you want to see the internet's background radiation for yourself — this is the cheapest and most educational way to do it. Ten dollars, twenty days, three million data points. Highly recommended.